Python library Seaborn
The Seaborn package is developed on top of the Matplotlib library. It is used to create more informative and attractive statistical graphics for the data analysts. Though Seaborn is a different package, it can also be used to improve the aesthetic aspects of matplotlib graphics.
Seaborn is a high-level interface to Matplotlib. Basically, Seaborn library is used to ease the challenging task of data visualization; as Matplotlib is based on low-level graphical interfaces.
As a matter of fact, Matplotlib is good but Seaborn is better. There are basically two drawbacks of Matplotlib that Seaborn can fix:
Matplotlib can be customized but it’s difficult to figure out which configuration settings are needed to make graphical plots more attractive. On the other hand, Seaborn comes with numerous customized themes and high-level interfaces to solve this issue.
While working with Pandas, Matplotlib doesn’t perform satisfactorily when it deals with DataFrames, while Seaborn functions typically work well on DataFrames.
We will write here two Python codes to understand the importance of exploratory data analysis. The first one will be written using Matplotlib, while the second one will be written using Seaborn.
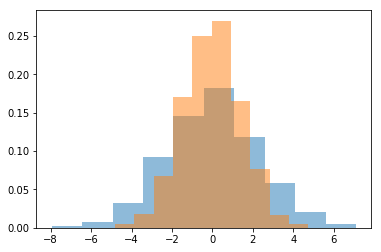
Using Matplotlib
See the coding example below:
import matplotlib.pyplot as plt
import numpy as np
import pandas as pd

# Create some data
data = np.random.multivariate_normal([0, 0], [[5, 2], [2, 2]], size=2000)
data = pd.DataFrame(data, columns=['x', 'y'])

for col in 'xy':
plt.hist(data[col], normed=True, alpha=0.5)
Output:
Using Seaborn
See the coding example below:
import numpy as np
import pandas as pd
import seaborn as sns

# Create some data
# multivariate_normal (mean, covariance, no_of_samples)
data = np.random.multivariate_normal([0, 0], [[5, 2], [2, 2]], size=2000)
data = pd.DataFrame(data, columns=['x', 'y'])

sns.set()

for col in 'xy':
sns.kdeplot(data[col], shade=True)
Output:
